Predicting stellar spectra and SED with FASTAR#
The core of FASTAR is its PCA-based, neural network stellar regressor. It is used in the synthesis of evolutionary models but can also be used to predict stellar spectra given a set of atmospheric parameters
[1]:
import numpy as np

from matplotlib import pyplot as plt
from fastar import StellarSynthesizer
Basic functionalities#
1. Spectroscopic predictions#
[2]:
# First, load the stellar synthesizer.
stellar_spec = StellarSynthesizer()

# Get the wavelength
wave_spec = stellar_spec.wave

# Then specify the desired atmospheric parameters
teff = np.log10(5000)
logg = 0.7
fmet = 0.3

# Get the spectrum
spec = stellar_spec.predict_spectrum(logg, teff, fmet)

# Normalize it over a wavelength range
b1 = 6000
b2 = 6100
sgood = (wave_spec > b1) & (wave_spec < b2)
spec = spec / np.median(spec[sgood])
2. Photometric predictions#
[3]:
# Similarly, an SED model for photometric predictions
# can also be generated.
#
# The only difference is that the stellar synthesizer
# has to be loaded using the photometric model
stellar_phot = StellarSynthesizer(model_label='phot')

# We repeat the process by getting the wavelengths,
# which cover a wider range in this case
wave_phot = stellar_phot.wave

# In this case, we use the same parameters
teff = np.log10(5000)
logg = 0.7
fmet = 0.3

# Get the spectrum
phot = stellar_phot.predict_spectrum(logg, teff, fmet)

# Normalize it over the same wavelength range
b1 = 6000
b2 = 6100
pgood = (wave_phot > b1) & (wave_phot < b2)
phot = phot / np.median(phot[pgood])
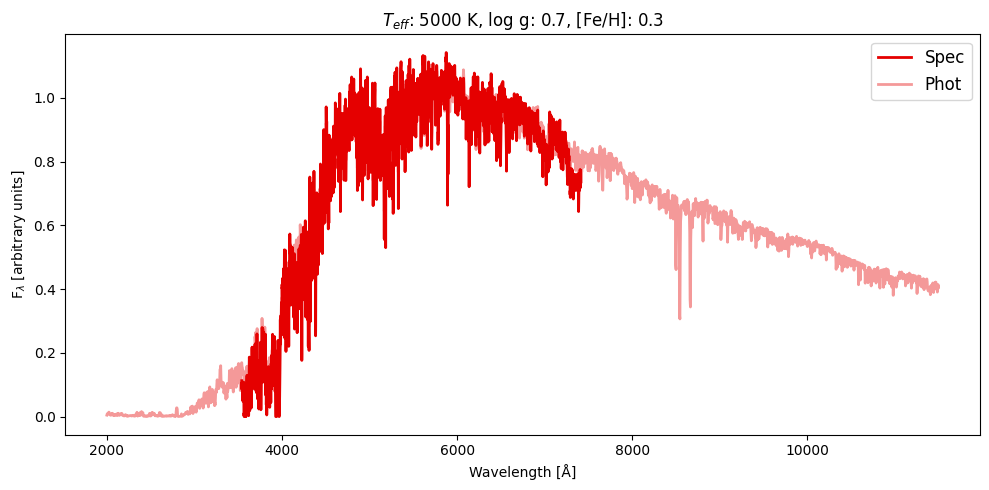
3. Combine spectrum and SED#
[4]:
# Let's see how it looks
fig, ax = plt.subplots(figsize=(10, 5))
ax.plot(wave_spec, spec, color='xkcd:red', linewidth=2, label='Spec')
ax.plot(wave_phot, phot, color='xkcd:red', linewidth=2, alpha=0.4, label='Phot')
ax.legend(fontsize=12)
ax.set_xlabel('Wavelength [Å]')
ax.set_ylabel(r'F$_\lambda$ [arbitrary units]')
ax.set_title(
    rf'$T_{{eff}}$: {int(np.round(10**teff, 0))} K, log g: {0.7}, [Fe/H]: {fmet}'
)
fig.tight_layout()
plt.show()